mark (he/him) is a software engineer, photographer, runner, and other things too sometimes.
Building RunDash - Part 1 of ?
Over the last year, I've had a lot of fun tracking my progress with Garmin Connect and Strava. They expose tons of data points about each run - pace, distance, heart rate, elevation gain, cadence, etc. These tools are amazing. Strava is a great social network where my friends and I can congratulate eachother after races or particularly grueling workouts. Garmin provides insights into how training is going. Who doesn't love seeing a chart with a positive trend?
However, I sometimes feel these platforms cater to an athlete who is more interested in min/maxing their performance through data insights. There is nothing wrong with this of course, but I am not trying to compete at a high level. If you are not interested in utilizing it, then too much data or too fine data is just noise. I'm a middle of the pack runner and perfectly content to hang out there. So which metrics - at a high level - show me how I'm improving? What I want is to quantitatively answer the questions:
- Am I running more often?
- Am I running longer?
- Am I running a little faster this year compared to last?
While those questions are likely answerable with Garmin and Strava if you dig a little bit, I wanted something that put those insights right infront of my face. Enter RunDash.
RunDash - A One Man Product (for now)
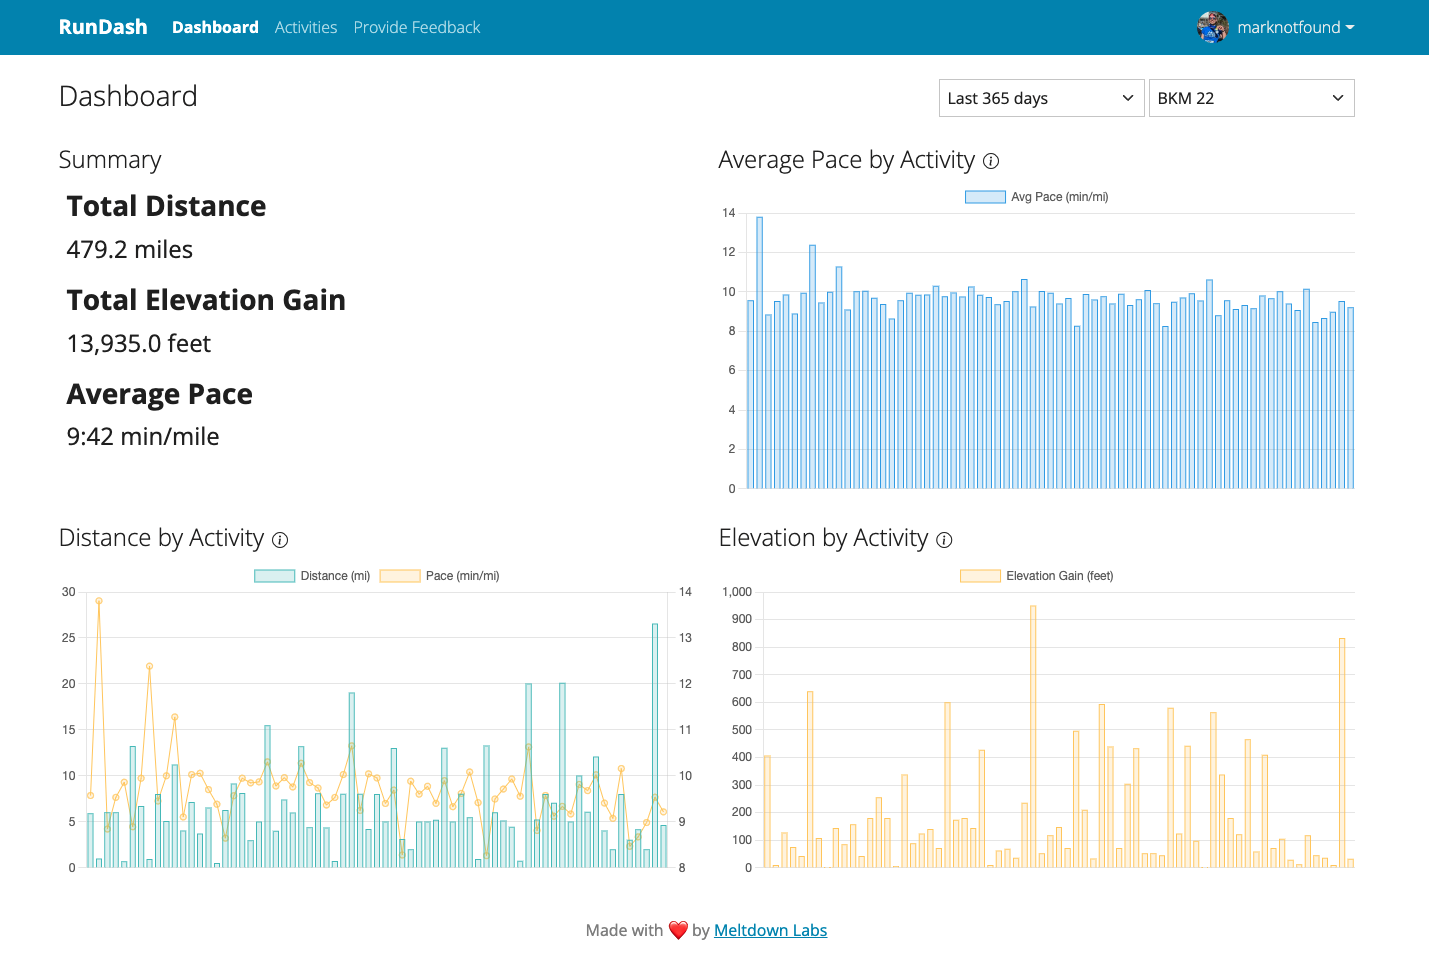 RunDash aims to answer those questions very simply by displaying key metrics on a fixed set of charts. You can log in, glance at your data and log off. You can tag runs however you want and filter on those tags to see trends. I like to tag runs by training block. So I tagged all of my training runs for the 2022 Brooklyn Marathon as "BKM '22". Now I can filter the metrics by that tag and see how my training progressed for that specific block.
All of the data comes from Strava, which is the only way to log into the application.
Infrastructure
RunDash is hosted on Heroku. I've not really used Heroku before this for any sort of "real" project. People claim it is expensive, but it allows me to get started for free/cheap and is basically ops team as a service. After upgrading to all paid services (one web dyno, one worker dyno, postgres) the total cost is $24/month. That's cheap operations.
For example, after opening signups to my local run club I quickly began to exceed the limits of the free postgres tier. Migrating to a paid postgres tier required less than 2 minutes of down time and running just a few CLI commands. Enter maintenance mode (provided by Heroku), create the new postgres instance, copy the data over, swap the new postgres credentials into an environment variable, leave maintenance mode. Very quick and easy.
Backend
The app is running on a familiar Django + gunicorn + celery + postgres stack. One of the goals of this project is to use and better learn Django best practices, so I am trying to take advantage of all it has to offer. Off the shelf authentication, templating system, unit testing tooling, etc.
Heroku handles crons via their scheduler addon. Crons are implemented as Django management commands.
Celery handles background tasks like importing activities from Strava or syncing up with incoming webhooks.
Frontend
While I'm perfectly capable of building a React app from scratch, I didn't want the complexity that comes with building/maintaining a React app. After all, this is (for now) a solo project. It doesn't make money (it loses exactly $24/month), so I want building it to spark some joy in my life. I learned about HTMX on Reddit and it seemed like an interesting tool. It's a very small JS library that lets you add HTML attributes to trigger XHR requests based on events. This means you can build a dynamic single page app without writing any JS. In fact, there is zero custom JS in RunDash. An event on the frontend triggers an API call and, instead of the server responding with JSON, it responds with an HTML fragment which HTMX then swaps into the DOM. It's lightweight, fast, and simple. chef kiss 👨🍳 More on HTMX in a follow up post.
The UI is built with Bootstrap 5 and a simple off the shelf theme. In an effort to keep things simple and reduce complexity, there is zero custom CSS. With this self-imposed constraint the product and UI stays a little simpler. After all, I'm not a designer. To some degree, it is best to use what Booststrap prescribes. The theme is admittedly not the prettiest or most modern, so this will be the first thing to go if/when I get more resources 😂.
Charting
Charting is done using Chart.js. Again one of the goals of this project is to keep it as simple as possible. Chart.js is very quick and easy to use. For now, it fits what the product sets out to do.
Up Next
I have more plans for RunDash and hope to eventually turn it into a microbusiness of sorts. I'm not sure what that means yet. Follow up posts will dive more into technical details, marketing, and business efforts.